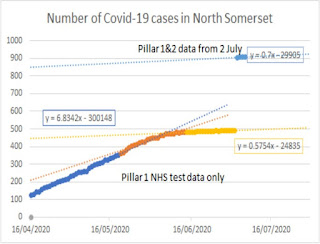
What is happening with Covid-19 in North Somerset? Part 3
I have been noting the number of cases in Bristol only since
23 May – see the plot below. These data
indicate rather little change in numbers of new cases. The change to Pillar1 & 2 numbers moved
the numbers from 729 to 1276, or from 157 cases per 100000 to 275 per 100000. The picture in Bristol is that the absolute
number of cases is higher than North Somerset, but the number per 100000 people
is well below that of North Somerset.
The only warning note to sound is that
while the number of cases per day in Bristol was less than one (0.9),
since the data has included Pillar 2 testing, the rate is now averaging 1.3
cases per day, higher than before.
That raises the profile of the Covid-19 app (see: https://covid.joinzoe.com/). PLEASE SIGN UP AND RECORD EVERY DAY, AT ROUGHLY
THE SAME TIME. The data collected from
over 3 million citizens can now be used to predict developing hotspots, e.g.
Leicester. Fingers crossed that Bristol
is not hotting up!


Comments
Post a Comment